Kaif
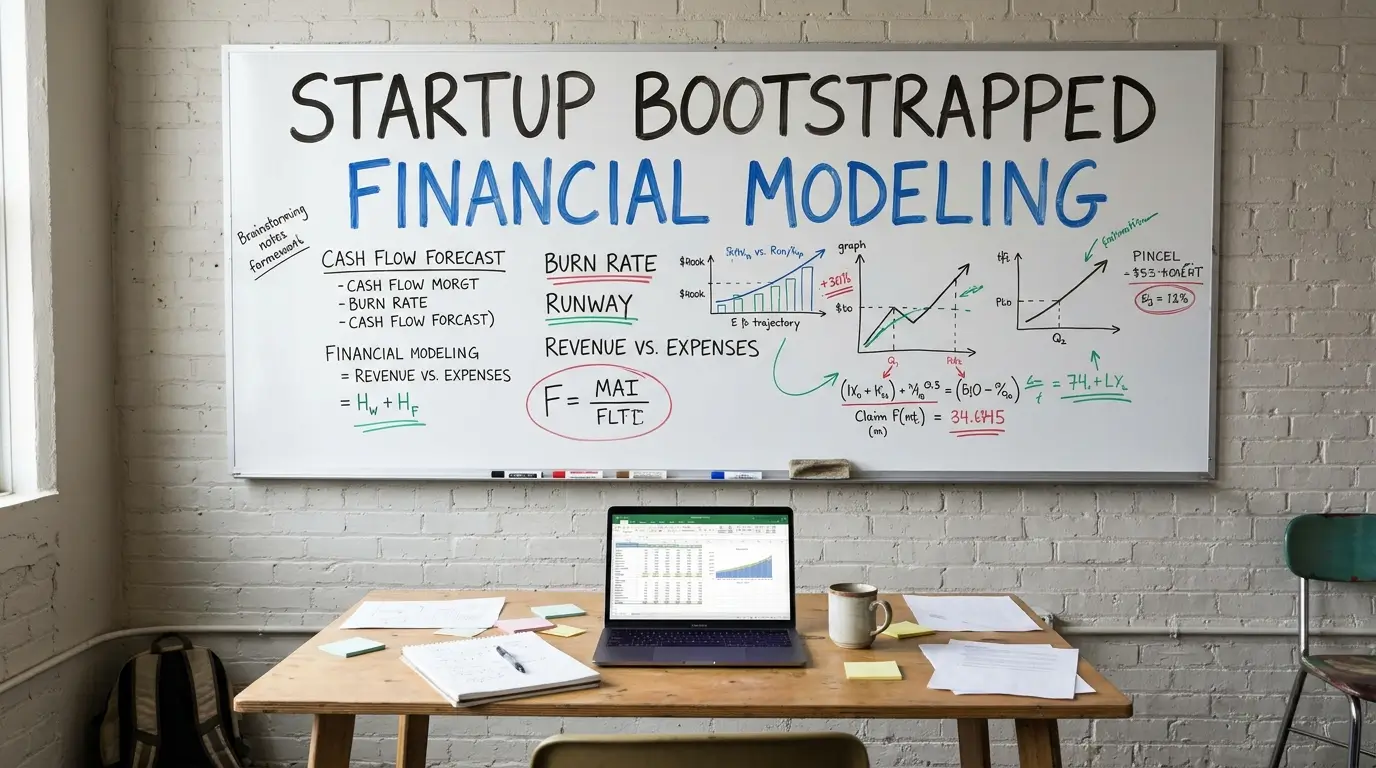
Running out of money is the clearest threat to a self-funded company, and a simple financial model is how you see it coming. Startup bootstrapped financial modeling (also searched as “startup booted financial modeling”) is the process of forecasting a self-funded startup’s revenue, costs, cash, and runway so you can decide when to spend, hire, or cut. This guide shows you how to build one.
Quick answer: A bootstrapped financial model forecasts monthly revenue, fixed and variable costs, cash balance, break-even, and runway, using conservative assumptions. Its purpose is survival and control, not impressing investors. Build it in a spreadsheet, test three scenarios, and update it monthly with actual results.
Key takeaways: Model cash, not just profit. Start with assumptions you can defend. Track runway and break-even every month. Always run a downside case. Keep the model simple enough that you’ll actually update it.
What Is Bootstrapped Startup Financial Modeling?

It is the process of forecasting the revenue, expenses, cash flow, profitability, and financial runway of a bootstrapped startup. The “booted” version of the phrase is generally used to describe financial modeling for a bootstrapped or self-funded startup.
Bootstrapping means funding the business from personal savings, early revenue, and sometimes small contributions from friends or family. Because there’s no investor to cover a gap, the model’s job is practical. One advisory firm puts the overriding purpose of a bootstrapped model as protecting cash.
Financial model vs. business plan
A business plan explains what you’re building and why. A financial model puts numbers on it, month by month. You need both, but the model is the one you’ll check weekly.
How Does a Bootstrapped Model Differ From a Venture-Backed One?
The structure is similar, but the priorities differ.
| Factor | Bootstrapped model | Venture-backed model |
|---|---|---|
| Main goal | Survive and stay in control | Reach a large outcome fast |
| Funding assumption | Revenue and personal cash only | Future funding rounds |
| Growth stance | Conservative, tied to cash | Aggressive, tied to targets |
| Key question | “How long can we last?” | “How fast can we scale?” |
| Time horizon | Short and detailed (6 to 18 months) | Often multi-year |
| Audience | You and your team | Investors and board |
One analysis frames the bootstrapped model as being concerned with survival, cash-positive operations, and sustained growth without reducing equity.
Why Cash Matters More Than Profit
A company can look profitable on paper and still run out of money if customers pay late or costs arrive first. That’s why a bootstrapped model tracks the cash balance each month.
The failure research supports the focus. CB Insights’ startup post-mortem analysis covers 385 companies with identifiable failure reasons, and because many cited several, its percentages add up to more than 100%. Its published shares for running out of cash vary by edition. A recent update reports that running out of cash is the most common endpoint, cited in 70 percent of cases, but that it’s rarely the root problem and marks the final chapter after deeper flaws surface.
The lesson for founders: a cash shortage is usually a symptom. A model helps you spot it early, while you can still fix the cause.
What Are the Core Components of the Model?
Keep it to six building blocks.
| Component | What it answers | Typical inputs |
|---|---|---|
| Revenue forecast | How much will we earn each month? | Customers, price, conversion, churn |
| Variable costs | What scales with each sale? | Payment fees, hosting per user, support |
| Fixed costs | What do we pay regardless? | Tools, contractors, rent, insurance |
| Cash flow | What’s actually in the bank? | Opening cash, receipts, payments |
| Break-even | When does revenue cover costs? | Fixed costs, contribution margin |
| Runway | How many months can we last? | Cash balance, net burn |
Revenue assumptions
Base revenue on evidence: current customers, conversion rates from your own tests, and real pricing. Avoid top-down guesses like “we’ll capture 1% of the market.” One software vendor’s guide notes that the strongest plans use both top-down to set ambition and bottom-up to validate whether current unit economics can get you there. For a bootstrapped company, bottom-up should lead.
Cost structure
Split costs into fixed (don’t change with sales) and variable (change with sales). The split drives break-even.
How Do You Build the Model? A Step-by-Step Process
You can create a usable first version in an afternoon. Treat it as a draft you’ll refine.
Step 1: Set the time frame and goal
Choose 12 months, monthly columns. State a clear goal, such as “reach break-even before cash drops below three months of expenses.”
Step 2: List your assumptions
Create a separate sheet with every input: price, starting customers, monthly growth, churn, each cost, and opening cash. Label where each came from (actual data, test result, or estimate).
Step 3: Forecast revenue
Multiply customers by price each month. For product businesses, use units sold times unit price. Keep growth modest and tie it to a channel you control.
Step 4: Add variable and fixed costs
Variable costs equal a percentage of revenue or a cost per unit. Fixed costs are monthly amounts. Include your own pay if you take any.
Step 5: Build the cash flow forecast
Each month: opening cash + cash in − cash out = closing cash. If customers pay later than they buy, shift receipts to match.
Step 6: Calculate break-even and runway
- Break-even customers = fixed costs ÷ (price × contribution margin).
- Runway (months) = cash balance ÷ net monthly burn.
Step 7: Test three scenarios
Run base, downside, and upside cases by changing growth and costs only. Compare cash balances.
Step 8: Update monthly
Replace forecasts with actuals each month and revisit assumptions. One founder guide advises building something structured that you’ll actually update as real numbers arrive, because a maintained model beats an accurate-looking one you abandon.
Worked Example: A Small Bootstrapped SaaS
This is a simplified, hypothetical example. It ignores taxes, churn, and payment timing, and the numbers are illustrative, not benchmarks.
Assumptions
- Starting cash: $30,000
- Starting customers: 10
- Price: $50 per customer per month
- Variable costs: 10% of revenue, so contribution margin is 90% ($45 per customer)
- Fixed costs: $3,400 per month (tools $600, contractor $1,500, marketing $900, other $400)
Break-even: $3,400 ÷ $45 = 75.6, so you need 76 customers.
Base case: 6 net new customers per month
Customers at month end = 10 + 6n.
| Month | Customers | Revenue | Contribution (×0.9) | Fixed costs | Net cash change |
|---|---|---|---|---|---|
| 1 | 16 | $800 | $720 | $3,400 | −$2,680 |
| 3 | 28 | $1,400 | $1,260 | $3,400 | −$2,140 |
| 6 | 46 | $2,300 | $2,070 | $3,400 | −$1,330 |
| 9 | 64 | $3,200 | $2,880 | $3,400 | −$520 |
| 11 | 76 | $3,800 | $3,420 | $3,400 | +$20 |
Total losses through month 10 add up to $14,650, so the cash low point is about $15,350. The business reaches break-even in month 11 with plenty of cushion.
Downside case: 3 net new customers per month
Customers = 10 + 3n. Break-even needs 76 customers, which doesn’t happen until month 22. But the 12-month cumulative loss is $24,870, leaving $5,130. Losses continue (about $1,195 in month 13, shrinking each month), and cash runs out around month 18, months before break-even.
What the example teaches
- Static runway misleads. At month 1, $30,000 ÷ $2,680 suggests about 11 months. In the base case the burn shrinks and you survive. In the downside case the burn shrinks too slowly, so you don’t.
- One variable decides the outcome. Growth of 6 versus 3 customers per month separates success from failure.
- Early warning. If actual growth tracks the downside by month 3, you can cut fixed costs or lift prices while you still have $20,000 or more.
Which Metrics Should You Track?
Focus on a handful.
| Metric | Formula | Why it matters |
|---|---|---|
| Net burn | Cash out − cash in | How fast cash is shrinking |
| Runway | Cash ÷ net burn | How long you can last |
| Gross margin | (Revenue − direct costs) ÷ revenue | Whether each sale is worth making |
| Break-even point | Fixed costs ÷ contribution per unit | Your target |
| Customer acquisition cost | Sales and marketing spend ÷ new customers | Whether growth is affordable |
| Payback period | CAC ÷ monthly contribution per customer | How fast a customer repays acquisition |
One guide notes that because bootstrapped startups typically lack large cash reserves and emergency funding, runway should be monitored continuously.
What Tools Should You Use?
Start simple. One founder-focused guide recommends beginning with Excel or Google Sheets. A spreadsheet is flexible, free or cheap, and you can see every formula.
Consider other tools when:
- You manage multiple products or entities.
- You need automatic syncing with accounting data.
- Several people must edit the model.
Check each vendor’s current pricing and features yourself, since they change.
What Mistakes Should Bootstrapped Founders Avoid?
- Modeling only the best case. Always run a downside.
- Hiring before revenue is stable. A new salary can erase months of runway. Set a revenue trigger, such as “hire when monthly revenue stays above X for three months.”
- Ignoring payment timing. Annual contracts help cash. Net-60 invoices hurt it.
- Forgetting your own pay. Decide whether you’ll pay yourself and model it.
- Overbuilding. A 40-tab model you never update is worse than a 3-tab one you do.
- Treating assumptions as facts. Label each as tested or guessed.
- Skipping a buffer. Keep a cash reserve beyond your projections for surprises.
When Should You Make the Model Investor-Ready?
Most bootstrapped founders never need to. Consider an upgrade if you decide to raise outside money, apply for a bank loan, or sell the company. Then add a multi-year forecast, a balance sheet and income statement linked to your cash flow, and clear documentation of assumptions. Your monthly cash model is a solid foundation for that.
If you’re deciding whether you need outside funding, the U.S. Small Business Administration’s startup-cost guidance is a good starting point for estimating what you actually need.
Frequently Asked Questions
What is startup bootstrapped financial modeling?
It is forecasting a self-funded startup’s revenue, costs, cash flow, and runway so the founder can manage cash and decide when to spend or hire.
What is “startup booted financial modeling”?
It’s a common variant spelling of startup bootstrapped financial modeling, used to describe financial planning for self-funded startups.
How do I build a financial model for a bootstrapped startup?
List assumptions, forecast monthly revenue, add fixed and variable costs, build a cash flow forecast, calculate break-even and runway, then test base, downside, and upside scenarios.
How far ahead should I forecast?
Twelve months in monthly detail is a practical start for most bootstrapped startups. Extend it only if you need to.
What tool is best for a bootstrapped financial model?
Google Sheets or Excel is enough for most early-stage founders. Move to dedicated software when complexity or collaboration demands it.
How do I calculate runway?
Divide your current cash by your net monthly burn. Recalculate every month, since burn changes as revenue grows.
Can a bootstrapped startup skip a financial model?
It can, but it’s risky. Without a model, you’re less likely to see a cash shortfall coming.
Conclusion
A good bootstrapped financial model isn’t complicated. It’s a monthly view of cash that shows when you break even and how long you can last if things go slower than planned. Build the draft this week, run the three scenarios, and compare your actual results with the forecast every month.